U.S. Senate / 119th Congress · 2025–2026
Explore Senate voting records
Find a senator. See how they vote. Follow the records.
Votes through Sept. 30, 2026893 contested roll calls · Coverage & sources
The bigger picture · Senate
Who votes together?
Each shape is a senator. Senators closer together generally vote alike. Select one to see exact comparisons.
119th Congress
893 contested votes
Through Sept. 30, 2026
These are recorded, contested votes—not every Senate decision. Voice votes and unanimous consent are not included. What’s counted?
Senators at this spot
A guide to voting patterns, not a political spectrum. Left and right do not mean liberal or conservative. Distances are approximate, especially within a party; select a senator for exact figures.
Map accuracy & statistical details
Overall the map tracks true distance closely: correlation 0.998, average gap 1.2 points. It is looser inside a party: correlation 0.838 among Democrats and 0.881 among Republicans, and the scale bar reads long there. A bar that reads 10 points stands for about 9.2 points among Democratic senators and about 6.6 points among Republican senators. The largest gap for any one pair is 19.3 points. Two axes cannot hold every small difference, so exact figures come from selecting a senator. These figures cover the 100 core senators only. The 2 placed senators are measured on 186 pairs with core senators, with correlation 0.996 and an average gap of 2.7 points.
2 senators listed separately from the map
104 senators on record · 102 on the map, 2 of them placed from fewer votes · 2 listed here
These senators are not placed on the map. Each served only part of this Congress or cast too few contested votes to be compared with enough of the others. The reason is given for each.
Cast 6 contested votes and shares fewer than 50 votes with 102 senators on the map.
Cast 0 contested votes and shares fewer than 50 votes with 102 senators on the map.


Find a senator
104 senators on record
| Senator | State | With party | Missed | Voting record |
|---|---|---|---|---|
| Maryland | 96.4% | 1.6% | View record | |
| Oklahoma | 99.4% | 0.0% | View record | |
| Wisconsin | 97.4% | 0.1% | View record | |
| Indiana | 99.1% | 1.3% | View record | |
| Wyoming | 99.3% | 0.4% | View record | |
| Colorado | 96.2% | 9.0% | View record | |
| Tennessee | 99.4% | 5.8% | View record | |
| Connecticut | 97.0% | 1.2% | View record | |
| Delaware | 97.2% | 0.7% | View record | |
| New Jersey | 94.5% | 4.4% | View record | |
| Arkansas | 99.2% | 1.5% | View record | |
| Alabama | 99.2% | 2.3% | View record | |
| North Carolina | 98.6% | 2.7% | View record | |
| Washington | 97.3% | 0.2% | View record | |
| West Virginia | 99.1% | 1.9% | View record | |
| Louisiana | 97.4% | 5.5% | View record | |
| Maine | 83.9% | 0.0% | View record | |
| Delaware | 93.9% | 5.7% | View record | |
| Texas | 99.7% | 1.4% | View record | |
| Nevada | 91.6% | 2.0% | View record | |
| Arkansas | 99.8% | 1.5% | View record | |
| North Dakota | 99.3% | 3.5% | View record | |
| Idaho | 99.7% | 1.2% | View record | |
| Texas | 98.5% | 5.1% | View record | |
| Utah | 99.0% | 2.1% | View record | |
| Montana | 99.7% | 2.8% | View record | |
| Illinois | 96.6% | 6.6% | View record | |
| Illinois | 92.6% | 2.7% | View record | |
| Iowa | 99.1% | 2.3% | View record | |
| Pennsylvania | 80.5% | 6.4% | View record | |
| Nebraska | 99.2% | 1.0% | View record | |
| Arizona | 92.0% | 12.7% | View record | |
| New York | 94.5% | 2.0% | View record | |
| South Carolina | 99.1% | 6.7% | View record | |
| South Carolina | 98.1% | 8.1% | View record | |
| Iowa | 99.2% | 2.6% | View record | |
| Tennessee | 99.1% | 3.5% | View record | |
| New Hampshire | 87.4% | 1.5% | View record | |
| Missouri | 95.2% | 4.0% | View record | |
| New Mexico | 93.5% | 3.7% | View record | |
| Colorado | 94.6% | 1.1% | View record | |
| Hawaii | 96.3% | 0.4% | View record | |
| North Dakota | 99.5% | 1.0% | View record | |
| Ohio | 98.6% | 0.0% | View record | |
| Mississippi | 99.1% | 1.9% | View record | |
| Wisconsin | 98.2% | 1.3% | View record | |
| West Virginia | 99.8% | 4.2% | View record | |
| Virginia | 89.6% | 1.2% | View record | |
| Arizona | 91.0% | 5.5% | View record | |
| Louisiana | 98.2% | 1.7% | View record | |
| New Jersey | 93.7% | 1.0% | View record | |
| Maine | 87.7% | 1.5% | View record | |
| Minnesota | 94.2% | 1.4% | View record | |
| Oklahoma | 99.4% | 0.7% | View record | |
| Utah | 97.6% | 3.1% | View record | |
| New Mexico | 96.7% | 1.3% | View record | |
| Wyoming | 98.7% | 3.3% | View record | |
| Massachusetts | 95.5% | 0.8% | View record | |
| Kansas | 99.5% | 0.9% | View record | |
| Kentucky | 96.6% | 15.0% | View record | |
| Pennsylvania | 99.5% | 2.8% | View record | |
| Oregon | 95.9% | 0.8% | View record | |
| Florida | 98.2% | 1.2% | View record | |
| Kansas | 98.0% | 5.8% | View record | |
| Ohio | 99.3% | 0.5% | View record | |
| Oklahoma | 99.3% | 5.5% | View record | |
| Alaska | 85.6% | 4.2% | View record | |
| Connecticut | 96.2% | 2.7% | View record | |
| Washington | 98.3% | 5.6% | View record | |
| Georgia | 95.4% | 5.6% | View record | |
| California | 95.9% | 3.6% | View record | |
| Kentucky | 85.2% | 4.5% | View record | |
| Michigan | 94.6% | 2.1% | View record | |
| Rhode Island | 93.9% | 0.9% | View record | |
| Nebraska | 99.5% | 1.0% | View record | |
| Idaho | 99.7% | 2.8% | View record | |
| Nevada | 90.0% | 1.5% | View record | |
| South Dakota | 98.9% | 0.9% | View record | |
| Florida | Not enough votes | Not enough votes | View record | |
| Vermont | 95.4% | 7.0% | View record | |
| Hawaii | 96.6% | 1.2% | View record | |
| California | 93.5% | 2.4% | View record | |
| Missouri | 99.3% | 1.2% | View record | |
| New York | 97.5% | 0.4% | View record | |
| South Carolina | 99.8% | 3.0% | View record | |
| Florida | 97.2% | 0.2% | View record | |
| New Hampshire | 86.3% | 4.0% | View record | |
| Montana | 99.5% | 2.6% | View record | |
| Michigan | 92.5% | 2.7% | View record | |
| Minnesota | 98.2% | 4.6% | View record | |
| Alaska | 96.0% | 3.1% | View record | |
| South Dakota | 97.9% | 0.1% | View record | |
| North Carolina | 96.2% | 12.5% | View record | |
| Alabama | 99.0% | 6.6% | View record | |
| Maryland | 96.8% | 1.5% | View record | |
| Ohio | Not enough votes | Not enough votes | View record | |
| Virginia | 90.6% | 4.4% | View record | |
| Georgia | 93.9% | 2.8% | View record | |
| Massachusetts | 95.7% | 1.5% | View record | |
| Vermont | 95.0% | 5.8% | View record | |
| Rhode Island | 94.6% | 3.9% | View record | |
| Mississippi | 98.7% | 3.5% | View record | |
| Oregon | 97.1% | 1.9% | View record | |
| Indiana | 98.8% | 0.9% | View record |





















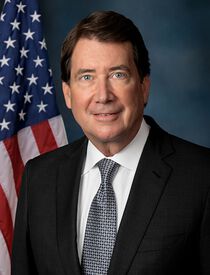




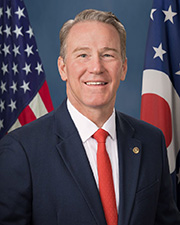










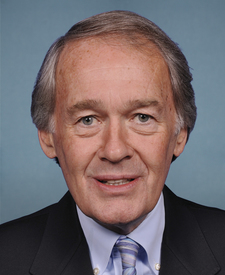





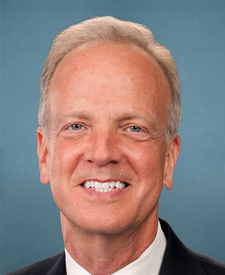




















No senators match these filters. Try another name or select “All states” and “All parties.”
Who votes with their party most and least
The percentage is the share of contested votes matching the senator’s party majority. Independents are measured against their caucus. These lists include senators on the map with enough votes to calculate a figure.
Republicans
Most often with their party
 Tom CottonArkansas99.8%
 James C. JusticeWest Virginia99.8%
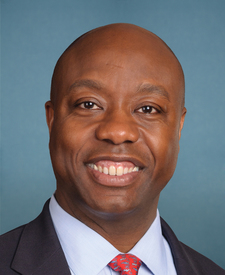 Tim ScottSouth Carolina99.8%
 Mike CrapoIdaho99.7%
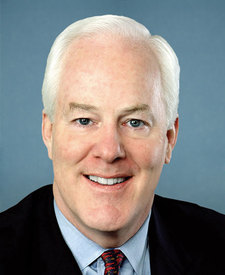 John CornynTexas99.7%
Least often with their party
 Susan M. CollinsMaine83.9%
 Rand PaulKentucky85.2%
 Lisa MurkowskiAlaska85.6%
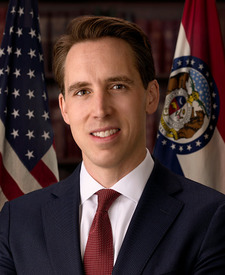 Josh HawleyMissouri95.2%
 Dan SullivanAlaska96.0%
Democrats and independents who caucus with them
Most often with their party
 Patty MurrayWashington98.3%
 Tina SmithMinnesota98.2%
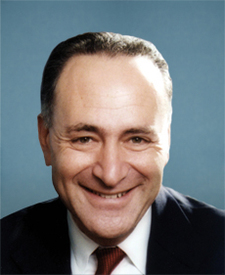 Charles E. SchumerNew York97.5%
 Tammy BaldwinWisconsin97.4%
 Maria CantwellWashington97.3%
Least often with their party
 John FettermanPennsylvania80.5%
 Jeanne ShaheenNew Hampshire86.3%
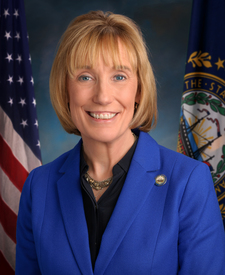 Margaret Wood HassanNew Hampshire87.4%
 Angus S. King, Jr.Independent, Maine87.7%
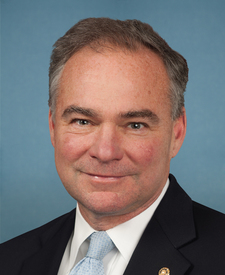 Tim KaineVirginia89.6%
A lower percentage means more votes against the party majority, which can reflect policy differences or procedure. How party voting is calculated